A recent anomaly (aka a piece of data that predicts future stock returns well without any apparent addition to risk) that has been discussed heavily over the last 5 years or so is the Gross Profitability Anomaly. This anomaly was formally documented by Robert Novy-Marx in 2009 and a version of the paper can be found here: http://papers.ssrn.com/sol3/papers.cfm?abstract_id=1598056
Gross profitability is simply (revenues – COGS) / Total Assets. In the implementation below, I divide trailing 12 month (revenues – COGS) by assets as of the last quarterly or annual report. To make sure results are not driven by illiquid/small cap stocks/some other weird stuff, I apply my standard restrictions screen to reduce the universe of investible stocks to those that are actually trade-able in size.
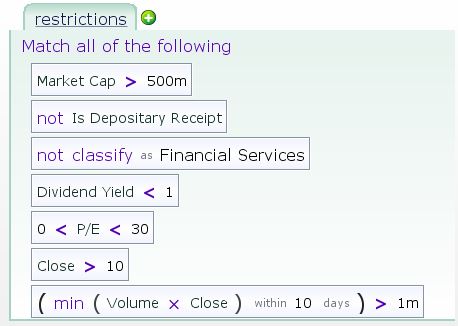
Within the set of stocks that pass these restrictions, I sort stocks into quintiles (5 buckets) based on gross profitability and follow these quintiles, rebalancing quarterly. The backtests are below:
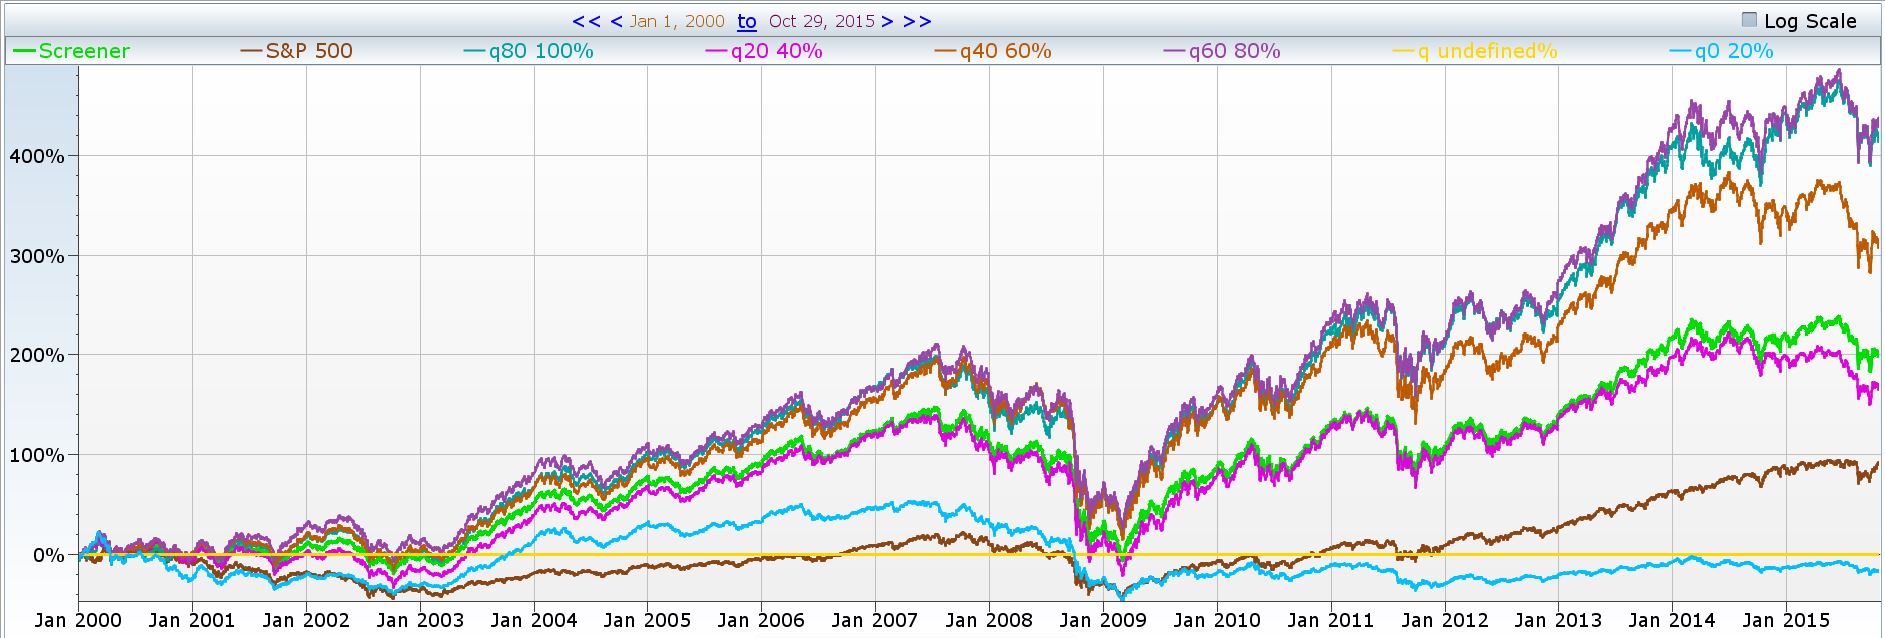
We can see the top 2 quintiles (top 40%) of stocks, ranked by the gross profitability metric quintuple our investment vale over the last 15 years; the market roughly doubles over the last 15 years and the lowest quintile (or bottom 20%) of gross profitability stocks *lose* money.
This is all the more remarkable when you consider that one of my restrictions above was a 0 to 30 PE … so we aren’t event including stocks that lose money in the bottom quintiles!
Sorting by profitability appears to enhance standard value screens and if you use value strategies, consider adding a profitability element to them to maximize your returns.
Very nice implementation Professor.
However, ror more robust algorithm, I would argue that (revenues – COGS) / Total Assets ratio should be ranked across industries or subindustries, as there is huge discrapency between “normal” level of Gross Profit Margin across sectors. Compare eg. stocks from retial, gross profit margin : ANF, WMT, AMZN.