A recent anomaly (aka a piece of data that predicts future stock returns well without any apparent addition to risk) that has been discussed heavily over the last 5 years or so is the Gross Profitability Anomaly. This anomaly was formally documented by Robert Novy-Marx in 2009 and a version of the paper can be found here: http://papers.ssrn.com/sol3/papers.cfm?abstract_id=1598056
Gross profitability is simply (revenues – COGS) / Total Assets. In the implementation below, I divide trailing 12 month (revenues – COGS) by assets as of the last quarterly or annual report. To make sure results are not driven by illiquid/small cap stocks/some other weird stuff, I apply my standard restrictions screen to reduce the universe of investible stocks to those that are actually trade-able in size.
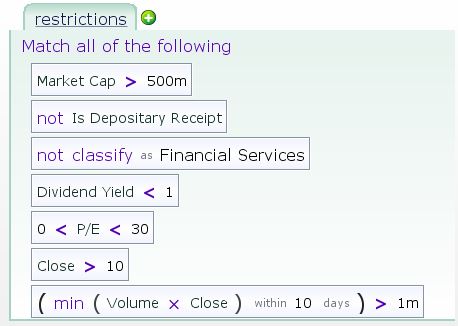
Within the set of stocks that pass these restrictions, I sort stocks into quintiles (5 buckets) based on gross profitability and follow these quintiles, rebalancing quarterly. The backtests are below:
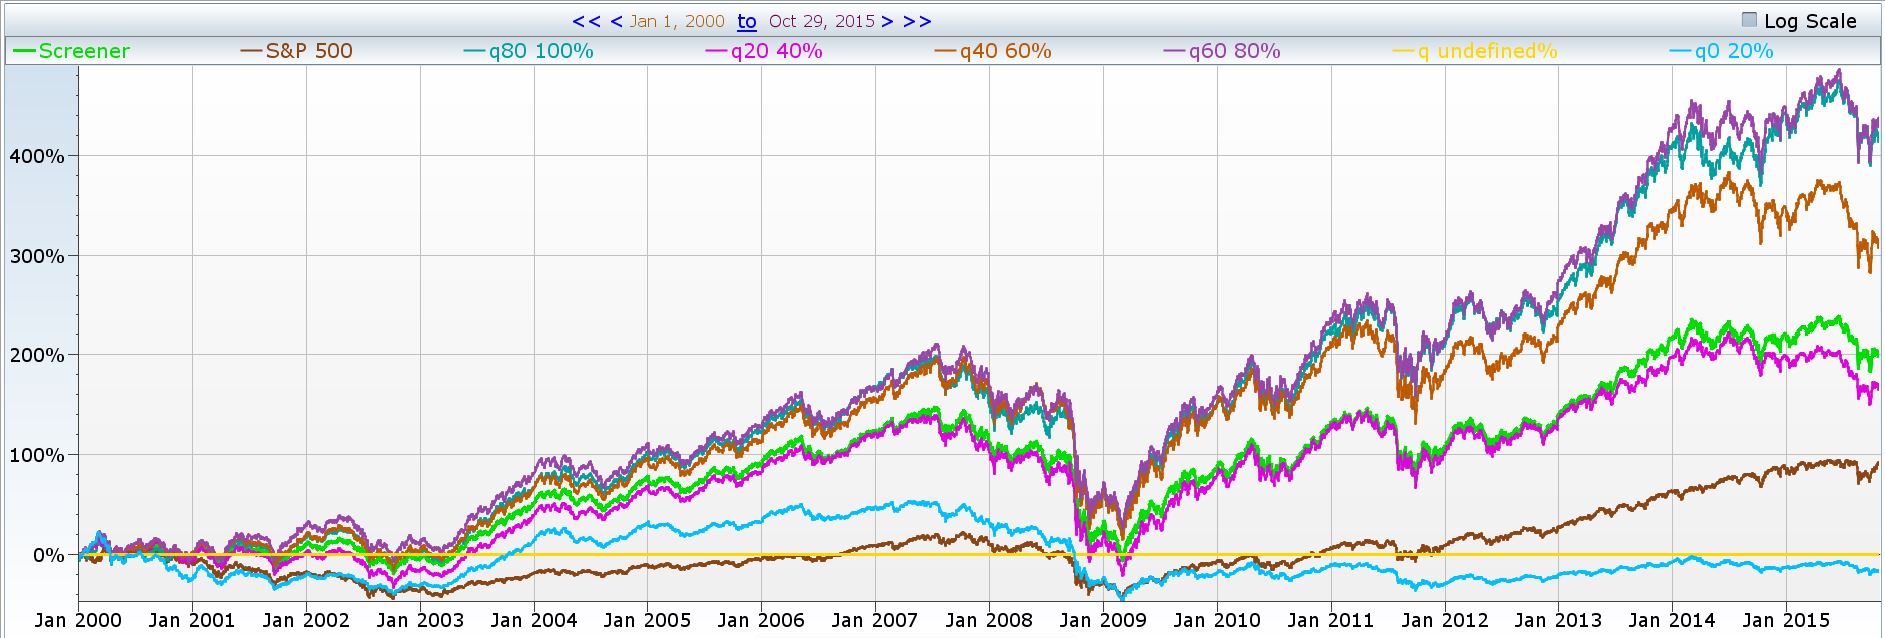
We can see the top 2 quintiles (top 40%) of stocks, ranked by the gross profitability metric quintuple our investment vale over the last 15 years; the market roughly doubles over the last 15 years and the lowest quintile (or bottom 20%) of gross profitability stocks *lose* money.
This is all the more remarkable when you consider that one of my restrictions above was a 0 to 30 PE … so we aren’t event including stocks that lose money in the bottom quintiles!
Sorting by profitability appears to enhance standard value screens and if you use value strategies, consider adding a profitability element to them to maximize your returns.