Wordclouds

As part of my adventures in natural language processing and learning Python, I wanted to try to learn how to make word clouds. We see these things all the time in powerpoint presentations.

They look fairly cool and the technology used to create them seems fairly straightforward. The computer counts the number of times a word appears in some text. Words that appear more frequently are bigger (ignoring common words like “the,” “of,” “a” and such) and words that appear sometimes but not as frequently are still shown, but take up less space.

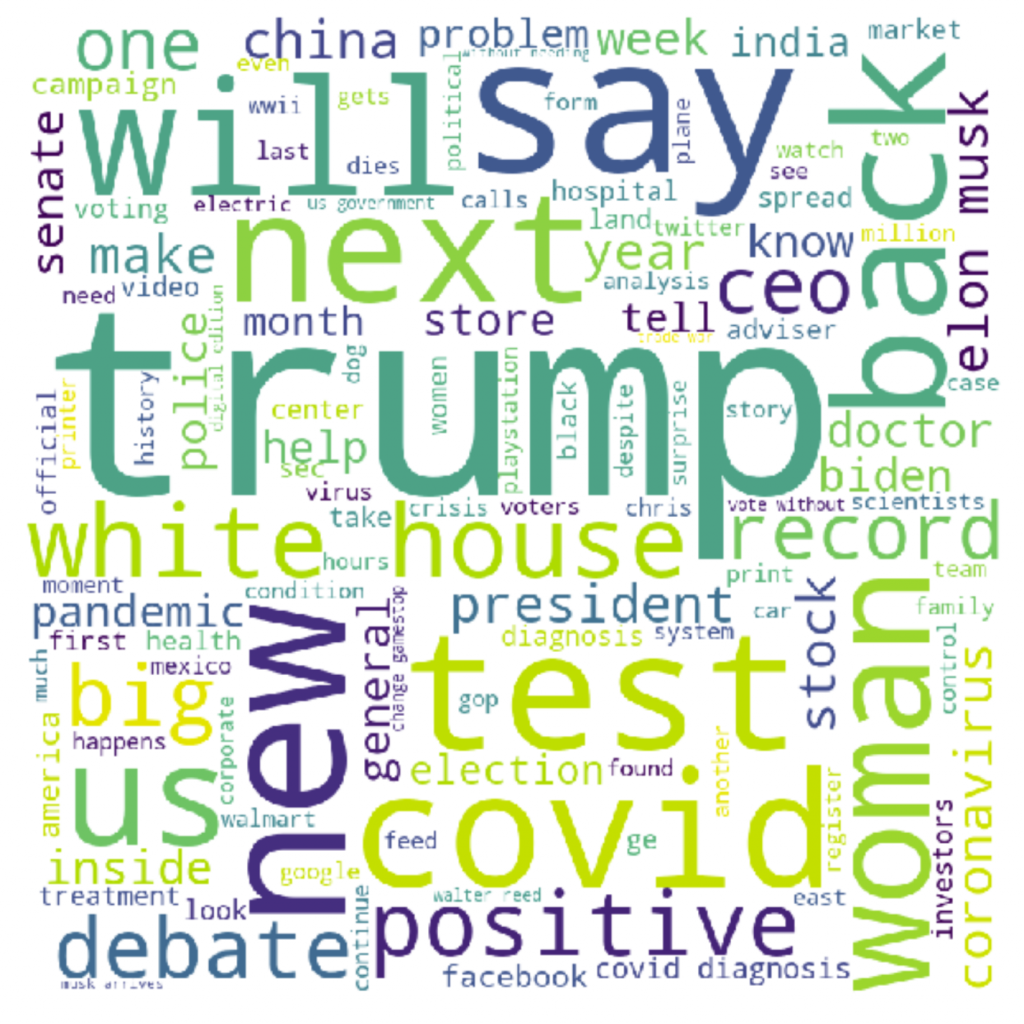
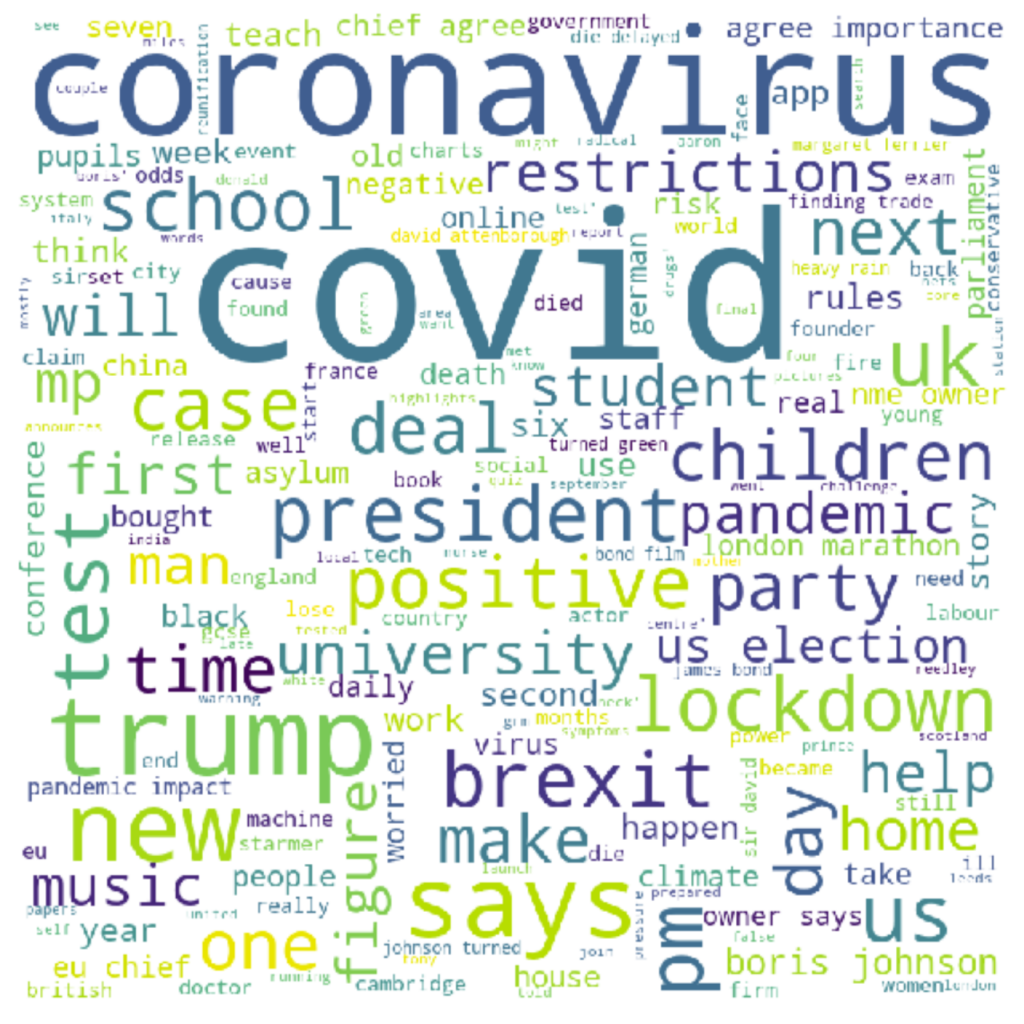
This was a bit before the 2020 election and I wanted to see if different news sources were covering different topics and I wanted to be able to visualize these differences easily.

I wrote some code (some repurposed from https://www.datacamp.com/community/tutorials/wordcloud-python ) to scrape the RSS feeds of various news sources and generate word clouds. These were the clouds I got from CNN and BBC.

CNN Wordcloud (Oct 3rd 2020)
BBC Word cloud Oct 3rd 2020

And this is the code I used to generate it. It’s currently set up for the CNN URLs, but you can put in what RSS feed URLs in and it should work (you will need to appropriately indent it to get it working, the indents don’t paste properly, unfortunately).


#import library
import requests
from bs4 import BeautifulSoup
#import pandas to create dataframe and CSV
import pandas as pd
import time
from wordcloud import WordCloud, STOPWORDS 
import matplotlib.pyplot as plt 


#enter URL
cnnurls = ["http://rss.cnn.com/rss/cnn_topstories.rss",
        "http://rss.cnn.com/rss/cnn_world.rss",
        "http://rss.cnn.com/rss/cnn_us.rss",
        "http://rss.cnn.com/rss/money_latest.rss",
        "http://rss.cnn.com/rss/cnn_allpolitics.rss",
        "http://rss.cnn.com/rss/cnn_tech.rss",
     #   "http://rss.cnn.com/rss/cnn_health.rss",
     #   "http://rss.cnn.com/rss/cnn_showbiz.rss",
     #   "http://rss.cnn.com/rss/cnn_travel.rss",
        "http://rss.cnn.com/rss/money_news_companies.rss",
        "http://rss.cnn.com/rss/money_news_international.rss",
        "http://rss.cnn.com/rss/money_news_economy.rss"
       ]
bbcurls = ["http://feeds.bbci.co.uk/news/rss.xml",
           "http://feeds.bbci.co.uk/news/world/rss.xml",
           "http://feeds.bbci.co.uk/news/uk/rss.xml",
           "http://feeds.bbci.co.uk/news/business/rss.xml",
           "http://feeds.bbci.co.uk/news/politics/rss.xml",
          # "http://feeds.bbci.co.uk/news/health/rss.xml",
           "http://feeds.bbci.co.uk/news/education/rss.xml",
           "http://feeds.bbci.co.uk/news/technology/rss.xml",
           "http://feeds.bbci.co.uk/news/entertainment_and_arts/rss.xml"
          ]
news_items = []
for url in cnnurls:
    resp = requests.get(url)

    soup = BeautifulSoup(resp.content, features="xml")

    items = soup.findAll('item')

    #print(len(items))
    
    #scarring HTML tags such as Title, Description, Links and Publication date
    for item in items:
        news_item = {}
        news_item['title'] = item.title.text
        news_item['description'] = item.description.text
       # news_item['link'] = item.link.text
       # news_item['pubDate'] = item.pubDate.text

        news_items.append(news_item)
    time.sleep(1)

df = pd.DataFrame(news_items,columns=['title','description'])
df.to_csv('CNNdata1.csv',index=False, encoding = 'utf-8')

df = pd.read_csv('CNNdata1.csv',encoding = 'utf-8') 
  
comment_words = '' 
stopwords = set(STOPWORDS) 
  
# iterate through the csv file 
for val in df.title: 
      
    # typecaste each val to string 
    val = str(val) 
  
    # split the value 
    tokens = val.split() 
      
    # Converts each token into lowercase 
    for i in range(len(tokens)): 
        tokens[i] = tokens[i].lower() 
      
    comment_words += " ".join(tokens)+" "
  
wordcloud = WordCloud(width = 800, height = 800, 
                background_color ='white', 
                stopwords = stopwords, 
                min_font_size = 10).generate(comment_words) 
  
# plot the WordCloud image                        
plt.figure(figsize = (8, 8), facecolor = None) 
plt.imshow(wordcloud) 
plt.axis("off") 
plt.tight_layout(pad = 0) 
  
plt.show()

Looping and scraping

In the previous posts, I covered how to scrape some data (like a stock price) from a website. To get a workable dataset, we can write some code to continually loop, and collect that same data at a fixed interval.

The code below does this. A few points. (1) Python uses indentation as part of the syntax. After starting a loop (the while 1==1: statement below) or a conditional (the if XXX==YYY statement below), everything you want looping or conditionally done has to be indented. (2) the while 1==1 line simply says keep doing this … forever. Since 1 will always be equal to 1. and (3) the if statement below checks if the current minute is divisible by 5 and runs the scraping code if it is. You can change the interval by changing 5 to another number, or using the now.second or now.hour numbers.

from selenium import webdriver
import datetime
import time
from multiprocessing import Pool,TimeoutError
import urllib.request
import re
from urllib.error import URLError, HTTPError

while 1==1:
now = datetime.datetime.now()
if now.minute/5 == int(now.minute/5):
driverspy = webdriver.Chrome()
driverspy.get(‘https://finance.yahoo.com/quote/SPY?p=SPY’)
sourcespy = driverspy.page_source
now = datetime.datetime.now()
found = re.search(‘”52″>(\d+\.\d+)</span>’, sourcespy).group(1)
print(“Time:”+str(now.hour)+”:”+str(now.minute)+”:”+str(now.second)+” Price:”+str(found))
time.sleep(75)
driverspy.quit()

While the code runs, you’ll get output that looks like the following. You can then either copy paste this to a CSV file or use Python code to export it in order to start building a dataset.

Time:12:15:20 Price:302.10
Time:12:20:8 Price:302.08
Time:12:25:19 Price:302.05
Time:12:30:20 Price:302.07
Time:12:35:9 Price:302.17
Time:12:40:9 Price:302.09
Time:12:45:28 Price:302.22
Time:12:50:28 Price:302.24
Time:12:55:16 Price:302.26
Time:13:0:8 Price:302.18
Time:13:5:9 Price:302.01
Time:13:10:8 Price:301.96
Time:13:15:28 Price:302.01
Time:13:20:29 Price:302.04
Time:13:25:8 Price:301.96
Time:13:30:20 Price:301.96
Time:13:35:19 Price:302.10
Time:13:40:28 Price:302.27
Time:13:45:20 Price:302.24
Time:13:50:8 Price:302.21
Time:13:55:8 Price:302.19
Time:14:0:8 Price:302.16

Quantitative Investing Beyond Equities

I recently received a reference request for an alumnus of my class who was seeking employment at a Financial Advisory Firm. It was a very pleasant and productive encounter – my former student advised me via email that I was listed as a reference and I might get a call; I received an email from a pretty high level person at my student’s prospective employer to schedule a call; we had a very productive call.

During the call, I told the employer about some of the quantitative investing stuff we do in in my class. The employer said it would be useful – their firm did similar stuff for a fixed income product. This was my second run-in with a firm that does quant stuff with fixed income. It appears quantitative investing is growing in fixed income, but there may also be issues.  (see https://www.barrons.com/articles/is-fixed-income-ready-for-factors-1530897141 )

Blackrock has a delightful webpage on the space ( https://www.ishares.com/us/strategies/fixed-income-factors ) where they highlight the main factors in fixed income (FI) as value, quality, momentum, carry, and low vol. Very similar to Equities. There’s also academic work in this regard ( https://papers.ssrn.com/sol3/papers.cfm?abstract_id=2516322  for example).

On the other hand, high transactions costs, large minimum investment amounts, minute differences between bonds that broad factors may not pick up (but that may end up making a huge difference), and buy-and-hold-to-maturity investors may prove to be headwinds in the space.

More specifically, there may be additional signals, besides the usual corporate finance and market price signals, that may be informative. The employer I spoke to was in the muni bond space, and was using geographic data ( I imagine micro level data from the various municipalities whose bonds they were considering )  to try and predict future credit moves.

I’d imagine with the wealth of data out there, and the variety of financial instruments traded, there may be some very interesting predictive relationships to be uncovered outside the equity markets.

Webscraping with Python

This is some code I wrote to scrape stock prices with Python. I wrote it on Jupyter notebook.

First off you’ll need chromedriver (Google “download chromedriver” and get the file on the first link. Put it in the folder with your Jupyter notebook.

Next, you’ll need a bunch of libraries, some of which will need to be pip installed.

from selenium import webdriver
import datetime
import time
from multiprocessing import Pool,TimeoutError
import urllib.request
import re
from urllib.error import URLError, HTTPError

In the code below, you won’t need all of this, but I’m just copying the entire import section of my code.

Next, we’ll fire up a browser.

driverspy = webdriver.Chrome()
driverspy.get(‘https://finance.yahoo.com/quote/SPY?p=SPY’)

This should open a python controlled browser that surfs its way to Yahoo Finance and loads up the page for SPY (a popular S&P 500 ETF).

Finally, we’ll define a function to scrape the price and then scrape the price off this page.

sourcespy = driverspy.page_source
found = re.search(‘”35″>(\d+\.\d+)</span>’, sourcespy).group(1)

If you look at the html code of the page_source of the Yahoo page with the SPY data, you’ll see it has, buried in it, something that looks like this:

<span class=”Trsdu(0.3s) Fw(b) Fz(36px) Mb(-4px) D(ib)” data-reactid=“35”>283.82</span><span class=”Trsdu(0.3s) Fw(500) Pstart(10px) Fz(24px) C($dataGreen)” data-reactid=”36″>+1.72 (+0.61%)</span><div

We rely on the bolded part always being the same (“35”> … </span> and encapsulating the bold+underlined price (283.82) to extract the price. The \d+.\d+ tells Python to look for a positive number, a period and another positive number.

Now, we have a basic scraper to get prices from Yahoo finance. If we set up a loop, we can get prices every few minutes and generate a time series dataset.