With my recent move to the University of Alabama from the University of Florida, I starting thinking about the topic of change. In the context of quantitative investing, I started thinking about changes in basic rules that we take for given when investing quantitatively and what we can do about them.
Here’s an example – academics have long taught the CAPM, a model that predicts that companies with higher systematic risk (risk stemming from overall market conditions) should outperform companies with lower systematic risk. This makes intuitive sense… riskier companies, especially companies with higher risk exposure to overall economic conditions *should* give higher returns, on average. The empirical evidence in the 70s and 80s (in hindsight) was mixed, but in general we accepted this wisdom.
However, starting in the 1990s, we started to question this basic assumption. Fama French 1992, Table II documented this:
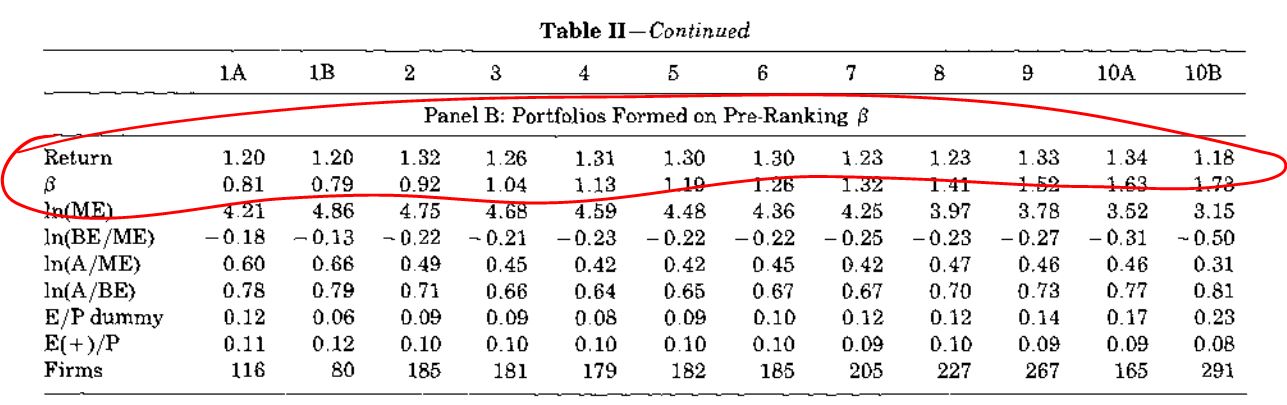
Companies are sorted by “pre-ranking betas” (simply the beta estimated using data from before the period we measure the returns) and the average monthly returns for the next year, by pre-beta deciles are presented. 1A and 1B are the 0-5% and 5-10% comapnies by pre-rnaking beta, 2-9 are the 2nd through 9th decile by pre-ranking beta, 10A and 10B are the 90-95% and 95-100% of firms by preranking beta.
Fama and French wrote, “the beta-sorted portfolios do not support the [CAPM]. … There is no obvious relation between beta and average returns.” [disclaimer: to my eyes, if I squint hard enough, I can sort of see a slight increase in average returns with beta, but the magnitude and monotonicity of the effect are both questionable.]
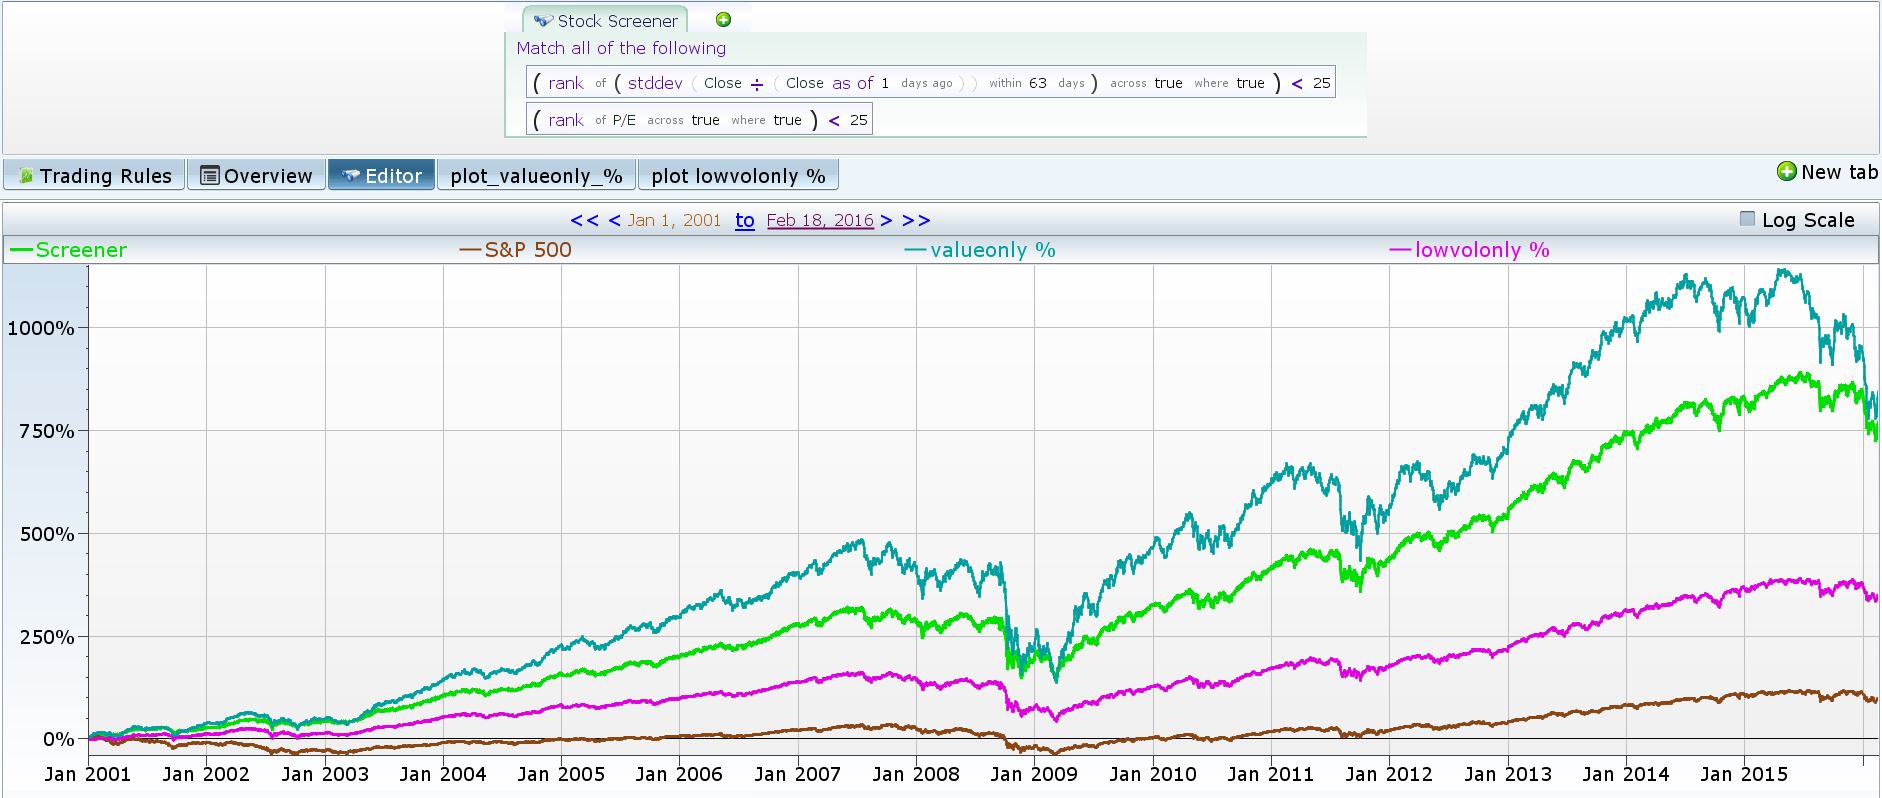
And so the decline of empirical belief in the CAPM started, and today, there is little faith that stocks with high market betas will outperform the market (although the CAPM is still widely taught). (see, for example “Is Beta Dead” from the Appendix of a popular Finance Textbook. )
In fact, the academic literature has made something of a 180 on this topic. The new hot anomaly is “low vol,” or “low beta.” This literature around this anomaly shows that the low volatility/low beta stocks actually outperform high volatility/high beta stocks and proposes several stories as to why this might be the case. If something so firmly grounded in theory can experience so complete a change, I think it’s a cautionary tale for *all* quantitative strategies … all things (including both the CAPM Beta and my time at Florida), run their course eventually.