In a new academic piece, we examine whether anomalies themselves exhibit momentum. Momentum in the context of investing refers to the idea that stocks that have done well recently continue to do well and stocks that have done poorly recently continue to do poorly. The momentum anomaly in stocks was widely publicized by Jagadeesh and Titman in their 1993 paper titled, “Returns to Buying Winners and Selling Losers: Implications for Stock Market Efficiency.”
We find this same idea holds for anomalies themselves. Examining 13 anomalies, we find anomalies that have performed well recently (in the last month), continue to do well next month. Anomalies that have been performing poorly recently continue to experience poor performance going forward. A chart makes this clear:
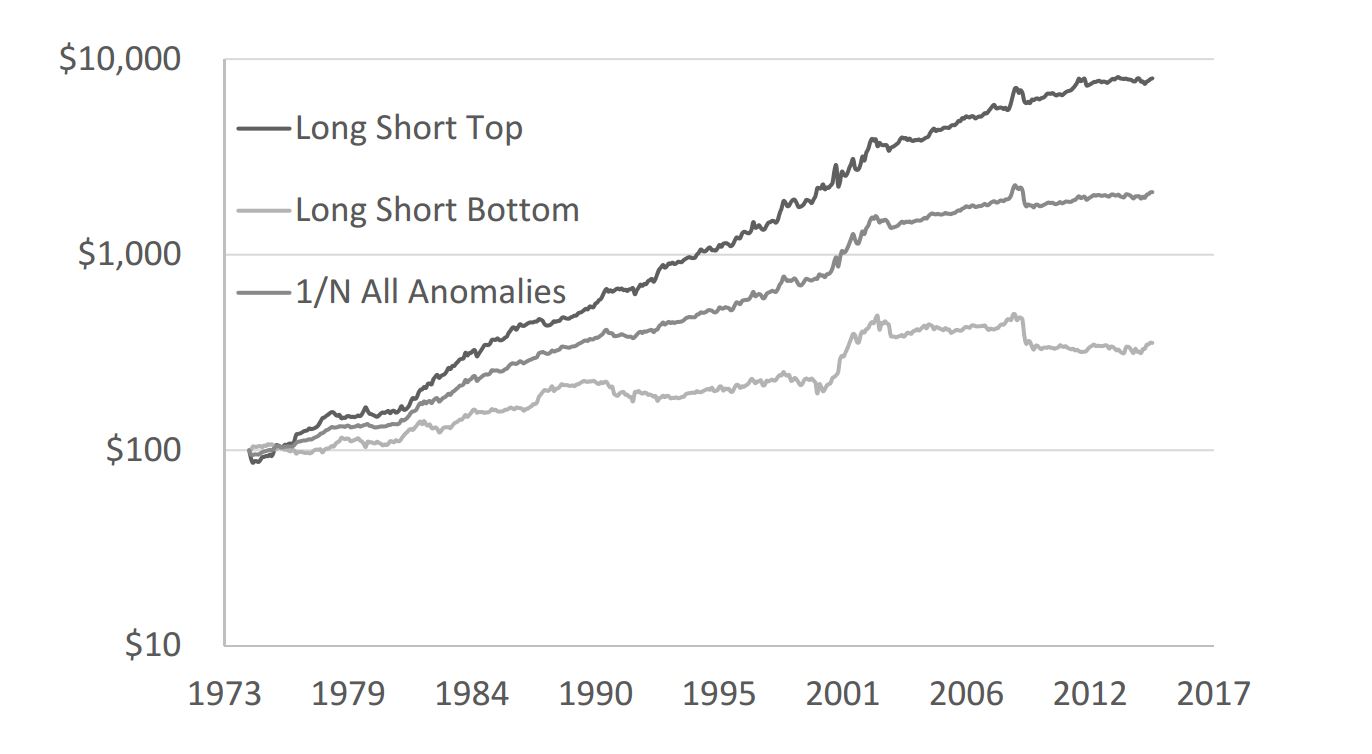
The chart documents the evolution of $10,000 invested in one of three strategies. The top line is a strategy that invests each month in the top half of the 13 anomalies (7 since investing in 6½ anomalies is hard) being analyzed, based on the 13 anomalies’ performance in the previous month. So, for example, if the value, momentum, size, profitability, accruals, investment level, and O-score anomalies did better than the other 6 anomalies we analyzed\ last month, the strategy would equally invest in these 7 anomalies. The bottom line does the opposite, investing in the bottom 6 anomalies and the middle line equally invests in all 13 anomalies across the entire period.
From the chart, it is clear that anomalies themselves exhibit momentum and the result is robust to the usual battery of academic tests. From a practitioner’s perspective, the implication is clear: if you’re interested in smart beta type investing, pick a strategy (or strategies) that has been doing well recently. From an academic’s perspective, the more interesting question is why. If you’re interested in our take on reasons for this, you can read our paper for some reasons we think we observe this momentum across anomalies.